PEEP

Programming Economic Experiments with Php/mysql

with contributions by:
Lucas Molleman
Jona Linde
Jeroen van de Ven
Roel van Veldhuizen
Boris van Leeuwen
Joep Sonnemans

Making graphs and drawings in html5


If you program for an laboratory experiment, and you use a modern browser that understands html5, you can use the possibilities in html5. See for example the pages on w3schools.com.

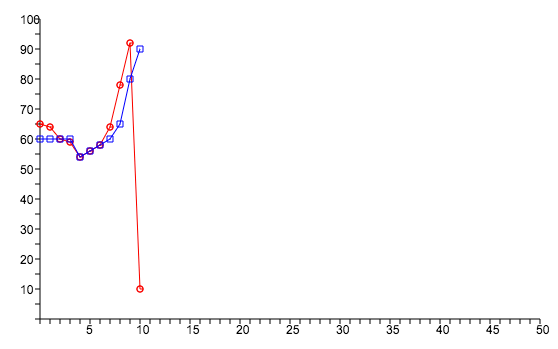
On the left you see an example of a graph, made using the capabilities of html. We see price predictions, and the realized prices in the first 10 periods. You make make very fancy graphs using libraries you can find on internet (e.g. corechart from google), but because these libraries have so many possibilities, they can be costly in download size and speed. In the this example no libraries are used, but only the standard functions of a modern browser. Download the code

<?php
//here you would read the data form the datebase into an array; the results should be like this:
$arrayprice=array(65,64,60,59,54,56,58,64,78,92,10);
$arrayprediction=array(60,60,60,60,54,56,58,60,65,80,90);
?>
<!DOCTYPE html>
<html>
<body>
<canvas id="myCanvas" width="600" height="350";">
</canvas>

<script>
var c = document.getElementById("myCanvas");
var ctx = c.getContext("2d");
ctx.beginPath();
ctx.strokeStyle = "#000000";
ctx.moveTo(50,20);
ctx.lineTo(50,320);
ctx.lineTo(550,320);
for (i = 0; i < 51; i++) { 
	ctx.moveTo(50+i*10,320);
	ctx.lineTo(50+i*10,325);
}
for (i = 0; i < 21; i++) { 
	ctx.moveTo(45,i*15+20);
	ctx.lineTo(50,i*15+20);
}
ctx.font = "12px Arial";
for (i = 1; i < 11; i++) { 
	ctx.fillText(i*5,50+i*50-4,335);
}
for (i = 0; i < 10; i++) { 
	ctx.fillText(100-i*10,30,i*30+25);
}
ctx.stroke();

ctx.beginPath();
ctx.strokeStyle="red";
var price= <?php echo json_encode($arrayprice) ?>;
for (i = 0; i < price.length; i++) { 
	ctx.moveTo(50+(i-1)*10,320-3*price[i-1]);
	ctx.lineTo(50+i*10,320-3*price[i]);
	ctx.arc(50+i*10,320-3*price[i],3,0,2*Math.PI);}
ctx.stroke();

ctx.beginPath();
ctx.strokeStyle="blue";
var prediction= <?php echo json_encode($arrayprediction) ?>;
for (i = 0; i < prediction.length; i++) { 
	ctx.moveTo(50+(i-1)*10,320-3*prediction[i-1]);
	ctx.lineTo(50+i*10,320-3*prediction[i]);
	ctx.rect(50+i*10-3,320-3*prediction[i]-3,6,6);}
ctx.stroke();

</script>
</body>
</html>
			

On the right you see a screenshot from an experiment of Roel van Veldhuizen, Hessel Oosterbeek and Joep Sonnemans about peer effects. In a group of 4 participants one person (A) does not observe the production of anyone but is observed himself, B observes and is observed, D observes but is not observed and C does not observe and is not observed. In html5 you define a canvas by <canvas id=b width="500" height="400"></canvas>. Within the coordinates of the canvas you can draw lines, rectangles, circles etc, or place gifs (like the eye). Here is a part of the javascript functions (originally from Boris van Leeuwen who has used this in network-experiments)

function draweyeleft(xpos,ypos,xsize,ysize) {
  var ctx = document.getElementById('b').getContext('2d');
  var img = new Image();
  img.src = 'eyeleft.gif';
  img.onload = function(){
    ctx.drawImage(img,xpos,ypos,xsize,ysize);
    ctx.beginPath();
    ctx.moveTo(30,96);
    ctx.lineTo(70,66);
    ctx.lineTo(103,76);
    ctx.lineTo(170,15);
    ctx.stroke();
  }
}

function canvas_arrow(context, fromx, fromy, tox, toy, dik, color){
    var angle = Math.atan2(toy-fromy,tox-fromx);
	//context.strokeStyle = color;
	//context.fillStyle   = color;
	context.strokeStyle = othercolor; //pijlen nu altijd blauw
	context.fillStyle   = othercolor;
	context.beginPath(); 
	context.moveTo(fromx, fromy);
    context.lineTo(tox, toy);
    context.lineWidth = sl*dik;
	context.stroke();
	context.beginPath(); 
	context.moveTo(tox, toy);
	context.lineTo(tox-headlen*Math.cos(angle-Math.PI/2),toy-headlen*Math.sin(angle-Math.PI/2));
	context.lineTo(tox-headlen*Math.cos(angle+Math.PI),toy-headlen*Math.sin(angle-Math.PI));
	context.lineTo(tox+headlen*Math.cos(angle-Math.PI/2),toy+headlen*Math.sin(angle-Math.PI/2));
	context.lineTo(tox, toy);
	context.lineWidth = 0.00001*dik;
	context.fill();
	context.stroke();
	context.closePath();
	}

function cirkel(ctx, x, y, r, kleur){
  //ctx.beginPath();
 //ctx.arc(x, y, bc+sc*r, 0, 2 * Math.PI, false);
  ctx.fillStyle = kleur;
  ctx.fill();
  ctx.fillRect(x,y,sqz,sqz);
  ctx.strokeStyle = fontkleur;
  ctx.strokeRect(x,y,sqz,sqz);
  }