Making graphs and drawings in html4
Click to enlarge
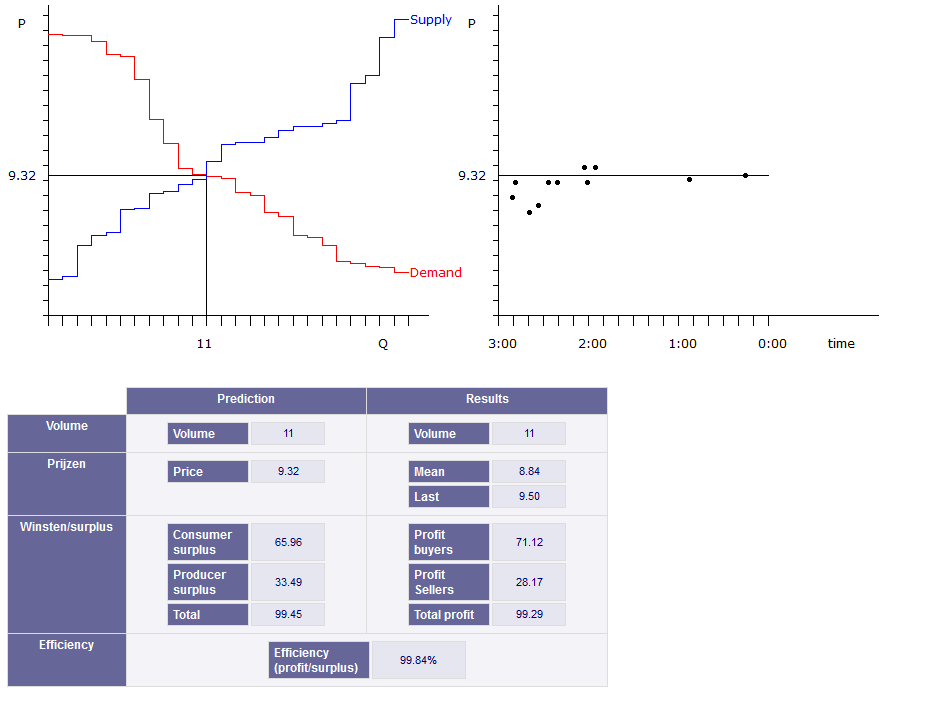
It is easy to make a picture or graph. In the past we used one of the many javascript packages that are around, e.g. jsgraphics (but there are probably other packages as good around). You define a canvas (a part of the screen you draw on) and you use coordinates to draw lines, circles etc. This is still a good idea if you want to make a webpage that can be viewed in all webbrowsers. The screenshot above is form a double-auction market for teaching purposes. Every period the values of buyers and sellers are randomly determined and at the end of the period the program shows a graph with the demand and supply curves based on these valuations. The results are compared with the predictions. This program was made in 2008, before html5 existed.
However, if you program for an laboratory experiment, and you use a modern browser that understands html5, you may better use the possibilities in html5. Html5 is also impressive in the animation possibilities, a funny example is the cursor-eating monster.
For another example of the jsgraphics, see the circletest.